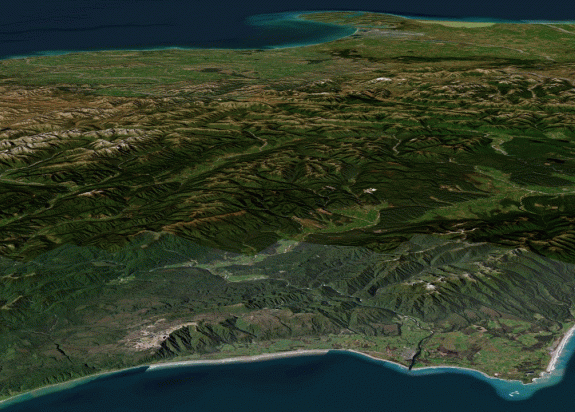
1:250 000 Geological Map
Map
The 1:250 000 scale geological map is ideal for regional level viewing. First published between 1959 and 1973 the maps were completely revised between 1996 and 2012 by the QMAP (Quarter Million Map) Project which also produced a rich digital dataset.
-
Overview
The 1:250 000 Geological Map of New Zealand dataset covers mainland New Zealand and the Chatham Islands. The more detailed 1:250 000 scale is better suited for regional applications and was originally compiled and published as 21 separate map sheets as part the QMAP project (1995-2012). The geological framework comprises mostly lithostratigraphic units but includes some chronostratigraphic units, particularly for Quaternary sediments. The dataset has geological feature layers for geological units and boundaries, landslide units and boundaries, textural and mineral metamorphism units and boundaries, faults, fold axial traces, horizons, dikes, veins, formlines, calderas, structural measurements and resources.
Geological units are represented as polygons with attributes describing, for example, stratigraphic affiliation, rock type and emplacement age. Sedimentary units are differentiated and coloured according to their depositional age, with overprints used to distinguish non-marine and coastal sediments. Late Cretaceous and younger intrusive and volcanic rock units, including widespread ignimbrite deposits in the North Island, are coloured shades of red to pink rather than the colours assigned to sedimentary units of comparable ages. Metamorphic rock units are portrayed according to their known or inferred protolith age and are also portrayed in terms of textural metamorphic zonation and mineral grade metamorphism. Major allochthonous units (Northland and East Coast allochthons) are distinguished by having a diagonal white stripe overprint on the underlying protolith body colour. Where deformation has sufficiently disassociated and mixed protoliths, the allochthon “matrix” is coloured grey, rather than by emplacement age.
Faults are represented by line features with attributes describing accuracy, type, orientation, name, and age, magnitude and sense of movement. Faults are differentiated in terms of their accuracy of location, type and activity status, and are shown in red if ‘active’ meaning fault rupture is known or likely to have occurred in the last 125 000 years. Fold axial traces may also be depicted as active.
Structural measurements are a selection of data from the underlying GIS layer. In some areas there is a considerable density of data available. The resources feature layer contains symbolised depictions of selected mineral occurrences, mines and quarries extracted from the Geological Resource Map of New Zealand dataset.
-
Background
In the early 1990s it was recognised that the existing 1:250 000 geological maps required significant updating to be fit for purpose. These first maps were created before the theories of plate tectonics and subduction zones were widely accepted and detailed mapping in many locations showed they were over simplified.
-
Update Methodology
The QMAP project produced a set of 21 new 1:250 000 geological maps by compiling all published and unpublished mapping and identifying areas where fieldwork would yield the most benefit. Once fieldwork was completed, the maps and an accompanying text was published. Each describes the area’s geomorphology, stratigraphy, tectonic history, geological resources, geological hazards and engineering geology in general terms.
In 2014 the digital versions of the 21 individual QMAPs were stitched together into a single seamless GIS dataset and released as the GNS Science Geological Map 1, the Geological Map of New Zealand 1:250 000 (1st edition). In 2018, an enhanced data structure was adopted that complied with the GeoSciML-Lite package of the GeoSciML 4.1 data model and data transfer standard and incorporated relevant CGI Geoscience Vocabularies terms. These data were released as a 2nd edition. In 2020, a 3rd edition was released that included new mapping in the Middlemarch, Victoria Range and Hawkes Bay area. In addition, the spatial representations of active faults were aligned with the New Zealand Active Fault Database and the topology of the North Island datasets significantly improved.
-
Formats
The 1:250 000 geological map is available as 21 separate maps with texts from the GNS Science Online Shop(external link).
The map is also viewable through the New Zealand geology webmap application(external link). GIS users can purchase the digital data which comes packaged with a choice of free GIS viewers or can access the data as Web Map Services and Web Feature Services from ArcGIS Server. GIS layerfiles that reference the web services are available for use in ArcGIS (ArcMap and ArcGIS Pro) and QGIS. Metadata that describes the GIS data and provides access to services and layerfiles is available from the GNS Science Dataset Catalogue (link(external link)).

Find more content related to:
GNS Science topics
- Ecosystems
- Geological time
- Mapping
- Natural hazards
- Natural resources
- QMAP
- Regional geology
- Stratigraphy
Locations
- Te Tai-o-Aorere / Tasman
- Rangitāhua / Kermadec Islands
- Rēkohu / Chatham Islands
- Rakiura / Stewart Island
- Murihiku / Southland
- Ōtepoti / Dunedin
- Ōtākou / Otago
- Ōtautahi / Christchurch
- Waitaha / Canterbury
- Kaikōura
- Te Tai Poutini / West Coast
- Te Tauihu-o-te-waka/ Marlborough
- Whakatū / Nelson
- Antarctica
- Te Whanga-nui-a-Tara / Wellington
- Manawatū-Whanganui
- Central Plateau
- Taranaki
- Te Matau-a-Māui / Hawke's Bay
- Te Tai Rāwhiti / Gisborne
- Te Moana-a-Toi / Bay of Plenty
- Waikato
- Tāmaki Makaurau / Auckland
- Te Tai Tokerau / Northland
- Aotearoa / New Zealand