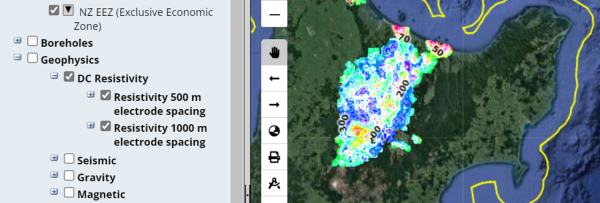
GNS DC resistivity map
Interactive web map
Resistivity data have a wide range of uses from crustal tectonic and geothermal studies to groundwater and archaeological applications. In New Zealand, a systematic DC resistivity mapping program ran from the mid-1960s until 1997. This resource contains maps, rasters and contours derived from the data.
Overview
In New Zealand, DC resistivity mapping proved ideal for investigating the upper c. 1 km of geothermal systems and their boundaries. From the mid-1960s until 1997, over 32,000 DC resistivity mapping observations were made. The greatest number of measurements are in the Taupo Volcanic Zone, with some smaller surveys in the Waihi area and at Ngawha in Northland.
All data collected since 1970 have been with the Schlumberger electrode configurations with nominal electrode spacings of AB/2 = 500m and AB/2 = 1000m. Prior to 1970, DC resistivity data were mostly collected using a Wenner array with electrode spacing 1800 ft (549 m) and 3600 ft (1097 m). Data collected in Lake Taupō used two 150 m long dipoles towed behind small boats, each boat separated by 500 m forming an equatorial dipole-dipole array.
DC resistivity mapping data observations are stored in an Oracle database at GNS Science. Read a full description of the data(external link)
Maps, rasters and contours derived from the data are available via E Tūhura - Explore Zealandia.(external link)

-
Terms of Use
GNS Science retains title to all intellectual property rights in the Products, including copyright. You will not remove or cover any proprietary notices placed on Products by GNS Science.
GNS Science grants you, a personal, non-exclusive, non-assignable, non-transferable licence to access and use the Products and to download those Products that are available for downloading. Read the full terms and conditions here(external link).