Earthquake forecasting
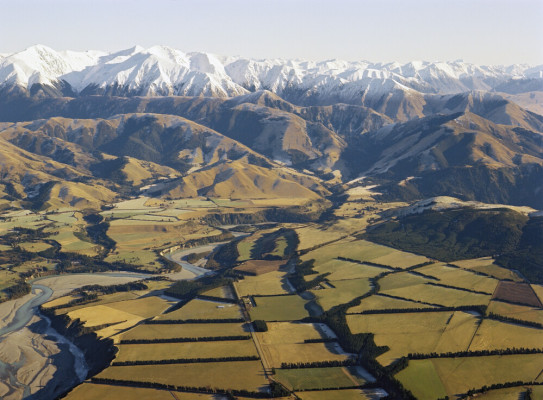
An earthquake forecast is an estimate of the probability an earthquake of a particular size will occur in a particular region and time period. These can be used to develop forecasts for ground shaking and its impacts.
Like climate and weather forecasts, we can use our understanding of geophysical processes and patterns in earthquake occurrence to build forecast models.
GNS Science has produced earthquake forecasts since the late 1990s, but it wasn’t until the 2010/11 Canterbury earthquakes that earthquake forecast information was publicly provided.
The earthquake forecasting models GNS uses are world class. They have been developed in collaboration with international experts and are built on years of scientific research. The models are rigorously tested so GNS scientists can be confident when using them to underpin advice for earthquake response and recovery, preparedness and long-term urban planning.
The earthquake forecasting process
Earthquake forecasting comprises:
- Model development – what features are included in the models and what data are used to build them including the GeoNet earthquake catalogue, earthquake geology and geodesy. No single model or data set can represent the full amount of knowledge and uncertainty around earthquake occurrence. Therefore, optimal forecasts require the use of multiple models that combine multiple data sets and timeframes (e.g. seismicity, geology, paleoseismology, geodesy, etc.).
- Model testing – how the model performs on independent data. Transparent real-time testing is carried out through international collaboration such as the Collaboratory for the Study of Earthquake Predictability (CSEP).
- Calculation of forecasts – the production of forecasts applying real-time earthquake data in tested models and calculating rates.
- Communication of forecasts – the generation of forecasting information, such as maps and tables, and its dissemination to end users. The forecasting information is also supported by expert advice to help decision-makers understand what they mean.
On rare occasions forecasts have been developed using expert elicitation, in low-probability, high-impact situations with little or no relevant data.
Earthquake forecast timescales
An earthquake forecast uses the patterns of earthquake occurrence in space and time. These patterns occur both prior to, and following, large earthquake events.
Patterns of occurrence are distinguished on three different time scales:
- Short term: earthquakes that occur within days to hours following a large earthquake. These aftershock earthquakes are due to the redistribution of stresses on the faults in the surrounding area. Aftershock sequences decay, meaning that the number of aftershocks decreases over time.
- Medium term: small earthquakes that occur months to decades prior to a large earthquake. These precursory earthquakes are part of the preparation process of a large earthquake. An increase in the rate of occurrence of small earthquakes in a region may increase the probability of a large earthquake occurring there in the medium term.
- Long term: the combination of earthquake physics and regular patterns of earthquake occurrence in time and space over many decades. Earthquakes tend to occur close to where they have occurred before, near plate boundaries and mapped faults, and in regions of high crustal strain.
Models are built for each of these timescales and combined to produce hybrid models that consider the known patterns of earthquake occurrence over all scales of time and space.
Forecast products
A range of products are produced to help communicate the probability of earthquakes and their potential impacts. These include tables, maps and scenarios.
Below are examples of forecast products developed to help decision-makers with response, recovery and long-term planning efforts.
-
National Seismic Hazard Model
The National Seismic Hazard Model (NSHM) is a key GNS Science forecasting product that calculates the likelihood and strength of earthquake shaking that may occur in different parts of Aotearoa New Zealand over specified time periods.
The NSHM presents a range of maps, hazard curves and reports that can be used to provide a forecast of the earthquake shaking expected over, for example, the next 10, 50 or 100 years at a range of probability levels.
The NSHM informs a range of safety, security, resilience, financial, and economic purposes such as building codes, infrastructure design, community resilience plans, hazard risk and loss models and more.
Key users of the NSHM include MBIE, the Natural Hazards Commission Toka Tū Ake, local and regional authorities, New Zealand Transport Authority, structural and geotechnical engineers, land-use planners, seismic hazard consultants, risk modelling consultants, and the insurance sector.
-
Tables
While no one can yet scientifically predict earthquakes, we can provide forecasts of future aftershocks (based on probabilities) from what is most likely to happen to what is very unlikely, but still possible. Most earthquake aftershock sequences decay (i.e. the number of earthquakes generally decreases) over time, with spikes of activity that can include larger earthquakes.
The below example table of aftershock probabilities was initially developed for a short-time horizon forecast following the 2016 Kaikoura earthquake, i.e. the upcoming 1, 7, 30 days. The current 1-year forecasts are available on the GeoNet aftershock forecasts web page(external link).

Forecast for Kaikōura aftershock forecast area (below) with the coordinates -40.7, 171.7, -43.5, 171.7, -43.5, 175.5, -40.7, 175.5 at 12 noon, Friday 18th November. * 95% confidence bounds.
Kaikōura aftershock forecast area (in red box)
-
Scenarios
The below future scenarios example was developed following the 2016 M7.8 Kaikōura earthquake. The scenarios were last updated at 1pm, 18/11/2016 and are no longer valid for use. Visit the GeoNet forecast web page(external link) for the most up to date Kaikōura earthquake forecasts.
Scenario 1: Extremely likely (>99% within the next 30 days)
The most likely scenario is that aftershocks will continue to decrease in frequency (and in line with forecasts) over the next 30 days. Felt aftershocks (e.g. over M5) would occur from the M7.8 epicentre near Culverden, right up along the Kaikoura coastline to the Cape Palliser/Wellington area. This includes the potential for aftershocks of between 6.0 and 6.9 (93% within the next 30 days). Scenario one will continue to play out, even if either scenario two or three also occurs.
Scenario Two: Unlikely (approximately 25% within the next 30 days)
An earthquake smaller than Monday's mainshock and between M7.0 to M7.8 would occur. There are numerous mapped faults in the Marlborough or Cook Strait areas capable of such an earthquake. It may also occur on an unmapped fault. This earthquake may be onshore or offshore but close enough to cause severe shaking on land. This scenario includes the possibility of an earthquake in the Hikurangi Subduction Zone. Earthquakes here or in the Cook Strait have the potential to generate localised tsunami. The Hawke’s Bay earthquake sequence in 1931 provides an analogy to scenario two, as a M7.3 aftershock occurred approximately 2 weeks after the initial M7.8 earthquake.
Scenario Three: Extremely unlikely (<1% within the next 30 days)
A much less likely scenario than the previous two scenarios is that recent earthquake activity will trigger an earthquake larger than Monday's M7.8 mainshock. This includes the possibility for an earthquake of greater than M8.0, which could be on the 'plate interface' (where the Pacific Plate meets the Australian Plate). Although it is still very unlikely, the chances of this occurring have increased since before the M7.8 earthquake.
-
Maps
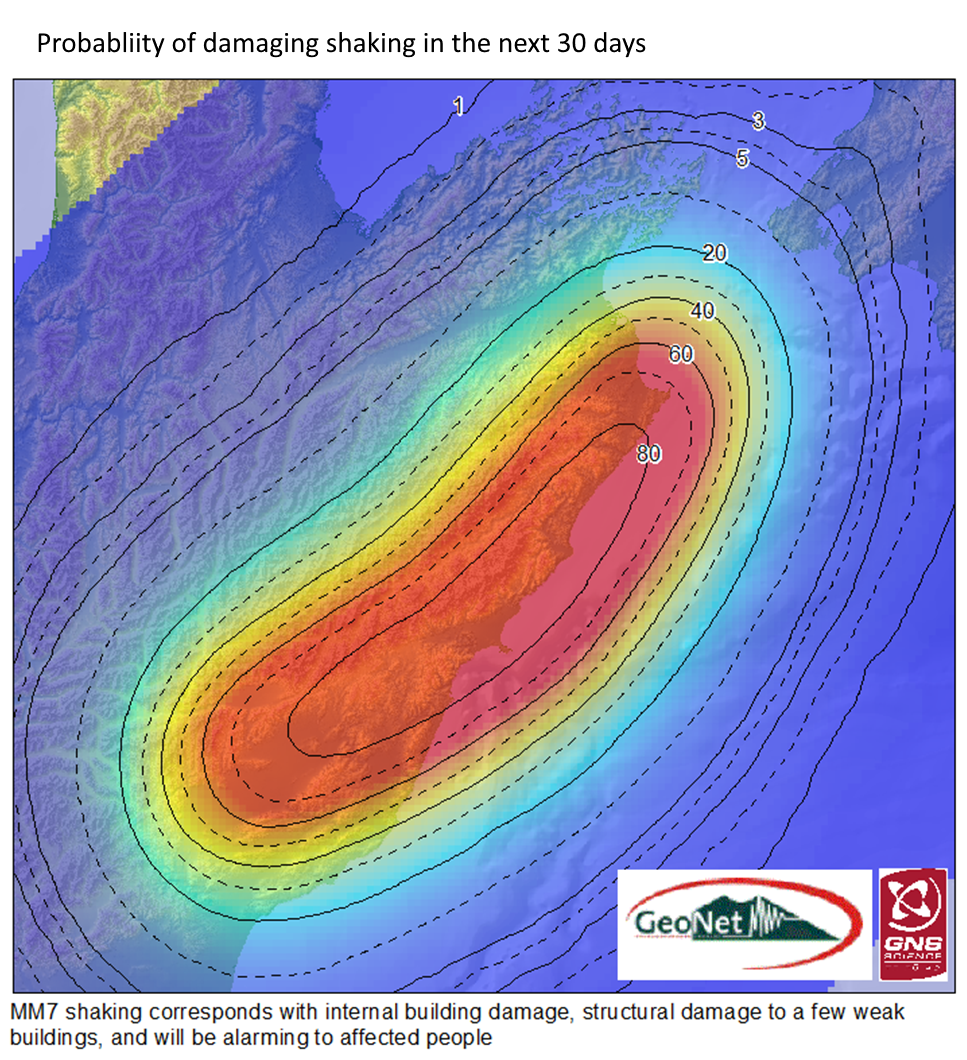
The below example map was developed to represent the aftershock shaking forecast following the 2016 Kaikōura earthquake.
The map presents the forecasted intensity of shaking from aftershocks (for the next 30 days from 17 November 2016) for shaking intensity MM7. This is represented by the Modified Mercalli Intensity (MMI) scale(external link), which is a different measurement to magnitude.
In reading the maps you could say the probability of MM7 shaking (in the next 30 days) around the wider Kaikoura/northern East Coast of the South Island (reflected by the red colour) is over 60%. In comparison, the probability of MM7 shaking in the Wellington region (the darker blue tones) is less than 10%.
How forecasts are used
Forecasts are used by a range of decision-makers across the different forecasting time scales to inform response and recovery efforts in the immediate aftermath of a large earthquake up to long-term planning decisions to increase resilience to future earthquake events.
Some examples include:
- Urban Search and Rescue (USAR) used earthquake forecasts for health and safety assessments before entering buildings for rescue operations following the Christchurch earthquake.
- Insurance companies use forecasts to inform a national risk profile and set rates accordingly.
- Emergency managers use forecasts to develop preparedness plans and direct resources following large earthquakes.
- Long-term forecasts are used to inform resilience and mitigation measures such as insurance, urban planning and building codes.
- The 50-year Christchurch forecasts underpinned the decisions on rebuilding the city and its infrastructure.
- 100-year forecasts were developed following the Kaikoura earthquake to inform the North Canterbury Transport Infrastructure Rebuild project and were also used to underpin the Building (Earthquake-prone Buildings) Amendment Act 2016, which requires owners of earthquake-prone buildings to do strengthening work within a determined time frame.

Commonly asked questions and answers
Can you predict earthquakes?
While the exact location, time, and magnitude of future earthquakes cannot be predicted, statistical models can be used to assess the likelihood of where and how large future earthquakes will be. This is called earthquake forecasting.
What is earthquake early warning?
Earthquake early warning is an alert system designed to detect and notify people as soon as an earthquake rupture begins and before ground shaking occurs. It is a race between detection and the time it takes for the P-waves (those that cause shaking) to reach the ground surface – typically ranging from a few seconds to a minute, depending on the proximity to the earthquake's hypocentre.
